Category: Uncategorized

  • Self-promo listicles: cited 2× less, brands still left out

    Self-promo listicles: cited 2× less, brands still left out

    Google AI Overviews used to lean on self-promotional “best X” listicles. Not anymore.

    In October 2026, AI Overviews cited them about half as often as they did in July.

    And here’s the part that stings: when an AI does cite one, the brand that ranked itself #1 rarely ends up near the top of the answer.

    We didn’t spot this first. Lily Ray did.

    On 100 B2B software queries, her follow-up found AI Overviews citing 38% fewer self-promotional listicles than in June.

    So we asked a simple question: does it hold up across other industries? We ran it on our full dataset of 11,025 commercial “best X” queries.

    The dataset. 11,025 commercial “best X” queries across SaaS, finance, insurance, legal, home services, marketing and more. Google AI Overviews and ChatGPT, US, July and October 2026. Every cited page was crawled and labelled by an LLM: is it a listicle, does the publisher list itself, and in what order are the brands listed.

    Google is citing far fewer self-promo listicles

    The shift is hard to miss.

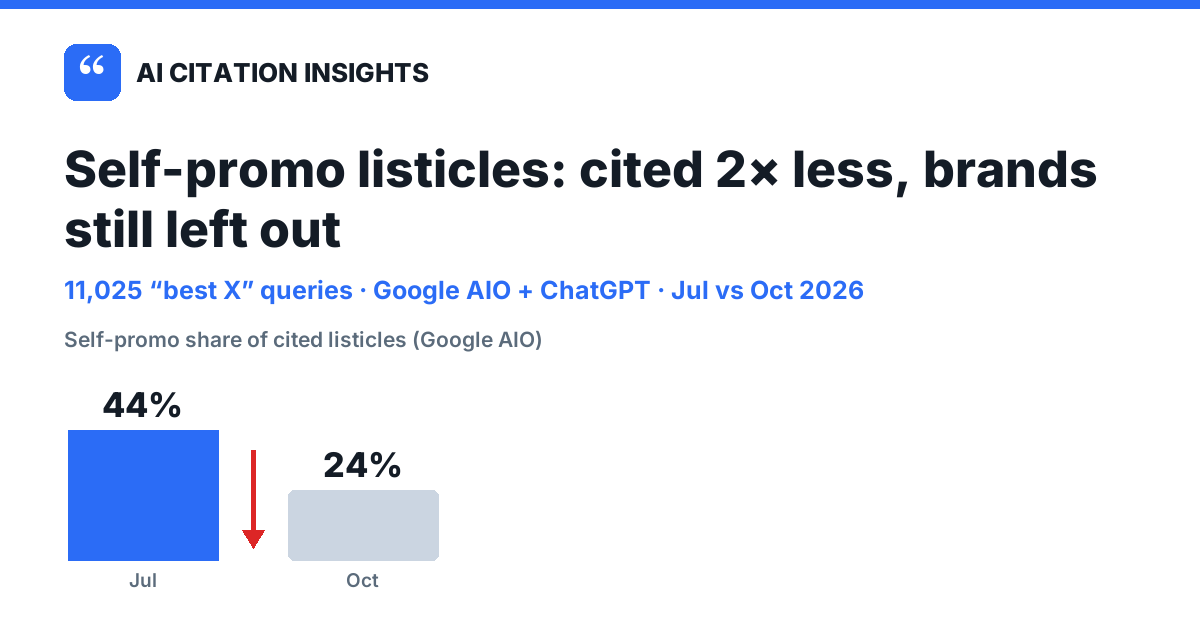
    0%25% 44% 24% JulyOctober
    Self-promotional share of the listicles Google AI Overviews cite.

    In July, self-promotional listicles made up 44% of the listicles Google AI Overviews cited.

    By October? Just 24%.

    And the drop is steeper than it looks.

    Google cites fewer listicles across the board. But self-promotional ones fell much faster.

    Per AI Overview, citations to listicles dropped 38%. Citations to self-promotional listicles dropped 66%.

    Same direction Lily found, now visible across 11k queries and a dozen verticals.

    Cited doesn’t mean recommended

    Getting cited sounds like a win. Usually, it isn’t.

    When AI Overviews cited a brand’s own self-promotional listicle, the brand wasn’t named in the answer at all. That happened 64% of the time in July, and 61% in October.

    And the ones that do slip through?

    They rarely reach the top. Here’s how often the brand at #1 of a cited listicle lands in the answer’s top 3:

    Brand at #1 of a cited listicle AIO, July AIO, Oct ChatGPT, July ChatGPT, Oct
    Ranked itself #1 (self-promo) 25% 25% 48% 35%
    #1 of a third-party listicle 45% 48% 58% 64%

    On Google, the gap barely moved. In both months, a self-ranked #1 made the top 3 about half as often as a third-party #1.

    Google cites these pages less now. And among the answers that still cite one, the self-ranking publisher is less likely to reach the top 3 than a third-party listicle’s #1.

    ChatGPT? Same story, and the gap is wider in October than in July.

    So is AI punishing self-promotion?

    Not really. These self-ranked #1s are mostly smaller brands. Their sites have about 4× fewer referring domains, and other listicles mention them about half as often. Compare the same brand as #1 on its own listicle versus #1 on someone else’s, and the gap shrinks to about 5 points and isn’t statistically significant. The AI isn’t penalizing self-promotion. A self-made listicle just can’t make a small brand look big.

    A note on the comparison. Our July ChatGPT data comes from the API and October from chatgpt.com, which runs a newer model. Part of the July-to-October change on ChatGPT reflects the product, not only time.

    ChatGPT cites them readily, but that buys little

    ChatGPT is more generous. It pulls a set of pages for each query, then cites some of them.

    And among the listicles it retrieved in October, it cited self-promotional ones far more often than third-party ones. Even after we excluded queries that name the publisher.

    0%50% 67% 41% Self-promotional listiclesThird-party listicles
    Of the self-promo vs third-party listicles ChatGPT had retrieved (October), the share it went on to cite. Two separate rates, not a split of one total. Queries naming the publisher excluded.

    So does a cited self-promo listicle actually help the brand?

    We put it to the test.

    We ran 537 queries through chatgpt.com a dozen times each. Then, within the same query, we compared the same brand in runs where its own listicle was cited against runs where it wasn’t.

    The result?

    Within the same query, citing a brand’s own listicle was associated with the brand being named about 10 percentage points more often, and reaching the top 3 about 5 to 8 points more often.

    And being named #1? Almost no change.

    That’s an association, not proof the citation caused it, and it doesn’t tell us the order in which ChatGPT chose the brand and its source.

    A small edge, then. Not a route to the top of the answer.

    Two platforms, one lesson

    • Google: cites self-promo listicles about half as often as in July.
    • ChatGPT: cites them readily, but ranking yourself #1 doesn’t carry the weight of a #1 on someone else’s listicle.
    • Both: the self-ranking publishers that slip are mostly smaller brands. A list you own can’t fake the authority a list you don’t own lends you.

    If your AI visibility leans on your own “Best X tools” page, it’s doing less than it looks. The real work happens on lists you don’t own.


    📊 11,025 commercial “best X” queries · SaaS, finance, insurance, legal, home services, marketing and more · Google AI Overviews + ChatGPT · US · July vs October 2026 · every cited page crawled and LLM-labelled · July ChatGPT data via the API, October via chatgpt.com · repeat test: 537 queries × ~12 runs on chatgpt.com. Context: Lily Ray’s study.
  • Reviews decide which local businesses ChatGPT names

    Reviews decide which local businesses ChatGPT names

    Everyone talks about listicles.

    But if you run a local business, there’s another factor that matters just as much.

    Your Google Maps reviews.

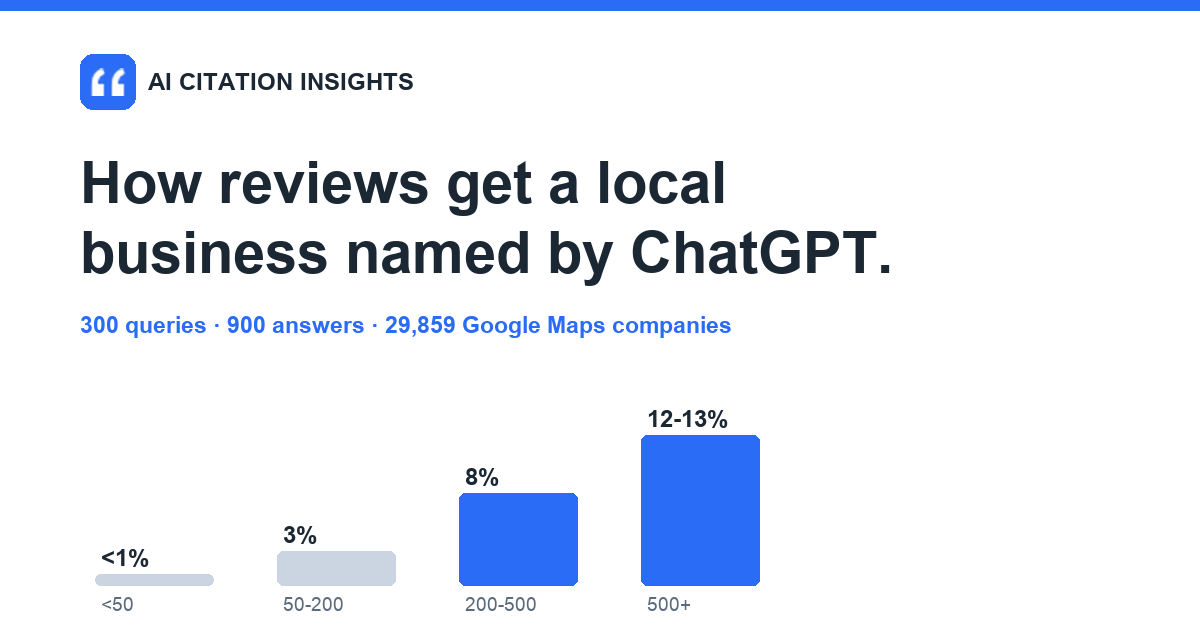
    So I ran the numbers. 300 queries like “best plumber in Austin TX” (10 niches across 30 US cities). I collected 900 ChatGPT answers and matched them against 29,859 companies pulled from Google Maps.

    Here’s what actually moves the needle:

    More reviews, more mentions

    0%10% <1% 3% 8% 12-13% <5050-200200-500500+ Google Maps reviews
    How often ChatGPT names a company, by its Google Maps review count.

    The pattern is hard to miss.

    Under 50 reviews? ChatGPT names you less than 1% of the time. Cross 500 reviews and that jumps to 12-13%.

    And the rating matters too.

    Drop below 4.5 stars and ChatGPT almost never names you. We’re talking about 1%.

    The map pack is the real lever

    Review count is big. But one thing beats it.

    The Google Maps top 3.

    If your company sits in the top 3 of the map pack for the same query (the map block at the top of Google), ChatGPT names you far more often.

    0%25% 33-38% 3% In Google Maps top 3Not in top 3
    Share of answers where ChatGPT names the company, by Google Maps map-pack position.

    Look at the gap.

    Top 3 in the map pack: named in 33 to 38% of answers. Not in the top 3: only 3%.

    That one spot is worth more than almost anything else you can do.

    Where ChatGPT actually gets its data

    You’d assume it pulls from Yelp or Reddit.

    It doesn’t.

    Those sites rank in Google’s top 10 for 66 to 74% of these queries. Yet ChatGPT opens them only about 1% of the time.

    So where does it go?

    Review aggregators and local-rating sites.

    Birdeye 57% Expertise.com 55% Angi 33% Yelp / Reddit ~1%
    How often ChatGPT opens each source when answering these local queries.

    Birdeye gets opened 57% of the time. Expertise.com, 55%. Angi, 33%.

    Yelp and Reddit? Around 1%.

    The playbook for local

    So here’s exactly what to do.

    Pile up Google Maps reviews, keep your rating at 4.8+, fight for a top-3 spot in the map pack for your target queries, and build profiles on Birdeye and Expertise.com.

    Listicles still help.

    But for a local business, reviews and the map pack are what actually get you named by ChatGPT.


    📊 300 queries (10 niches × 30 US cities) · 900 ChatGPT answers · 29,859 Google Maps companies · chatgpt.com via the DataForSEO LLM Scraper · October 2026.

  • I inflated DR from 0 to 71 on a domain that didn’t exist

    I inflated DR from 0 to 71 on a domain that didn’t exist

    SEO metrics are easier to fake than most people think.

    Back in 2023 I tested this the dumb way.

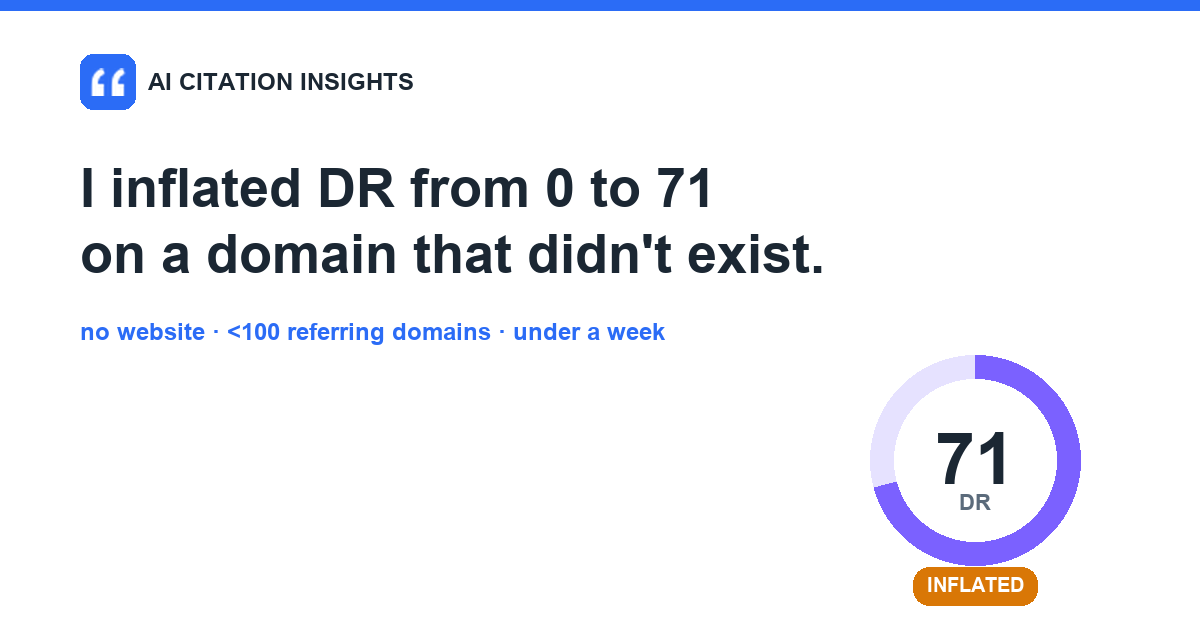
    I tried to boost the DR of a site that literally didn’t exist. The domain wasn’t even registered.

    No traffic.
    No content.
    No rankings.
    No real backlinks.

    Just one goal: move the metric.

    Disclaimer. This kind of link building gives you zero meaningful SEO value. It will not bring traffic or rankings. The point is only to show how easily the number moves.

    Fast forward three years.

    I wanted to see if anything had changed.

    So here’s what I did:

    I ordered a random Fiverr gig.

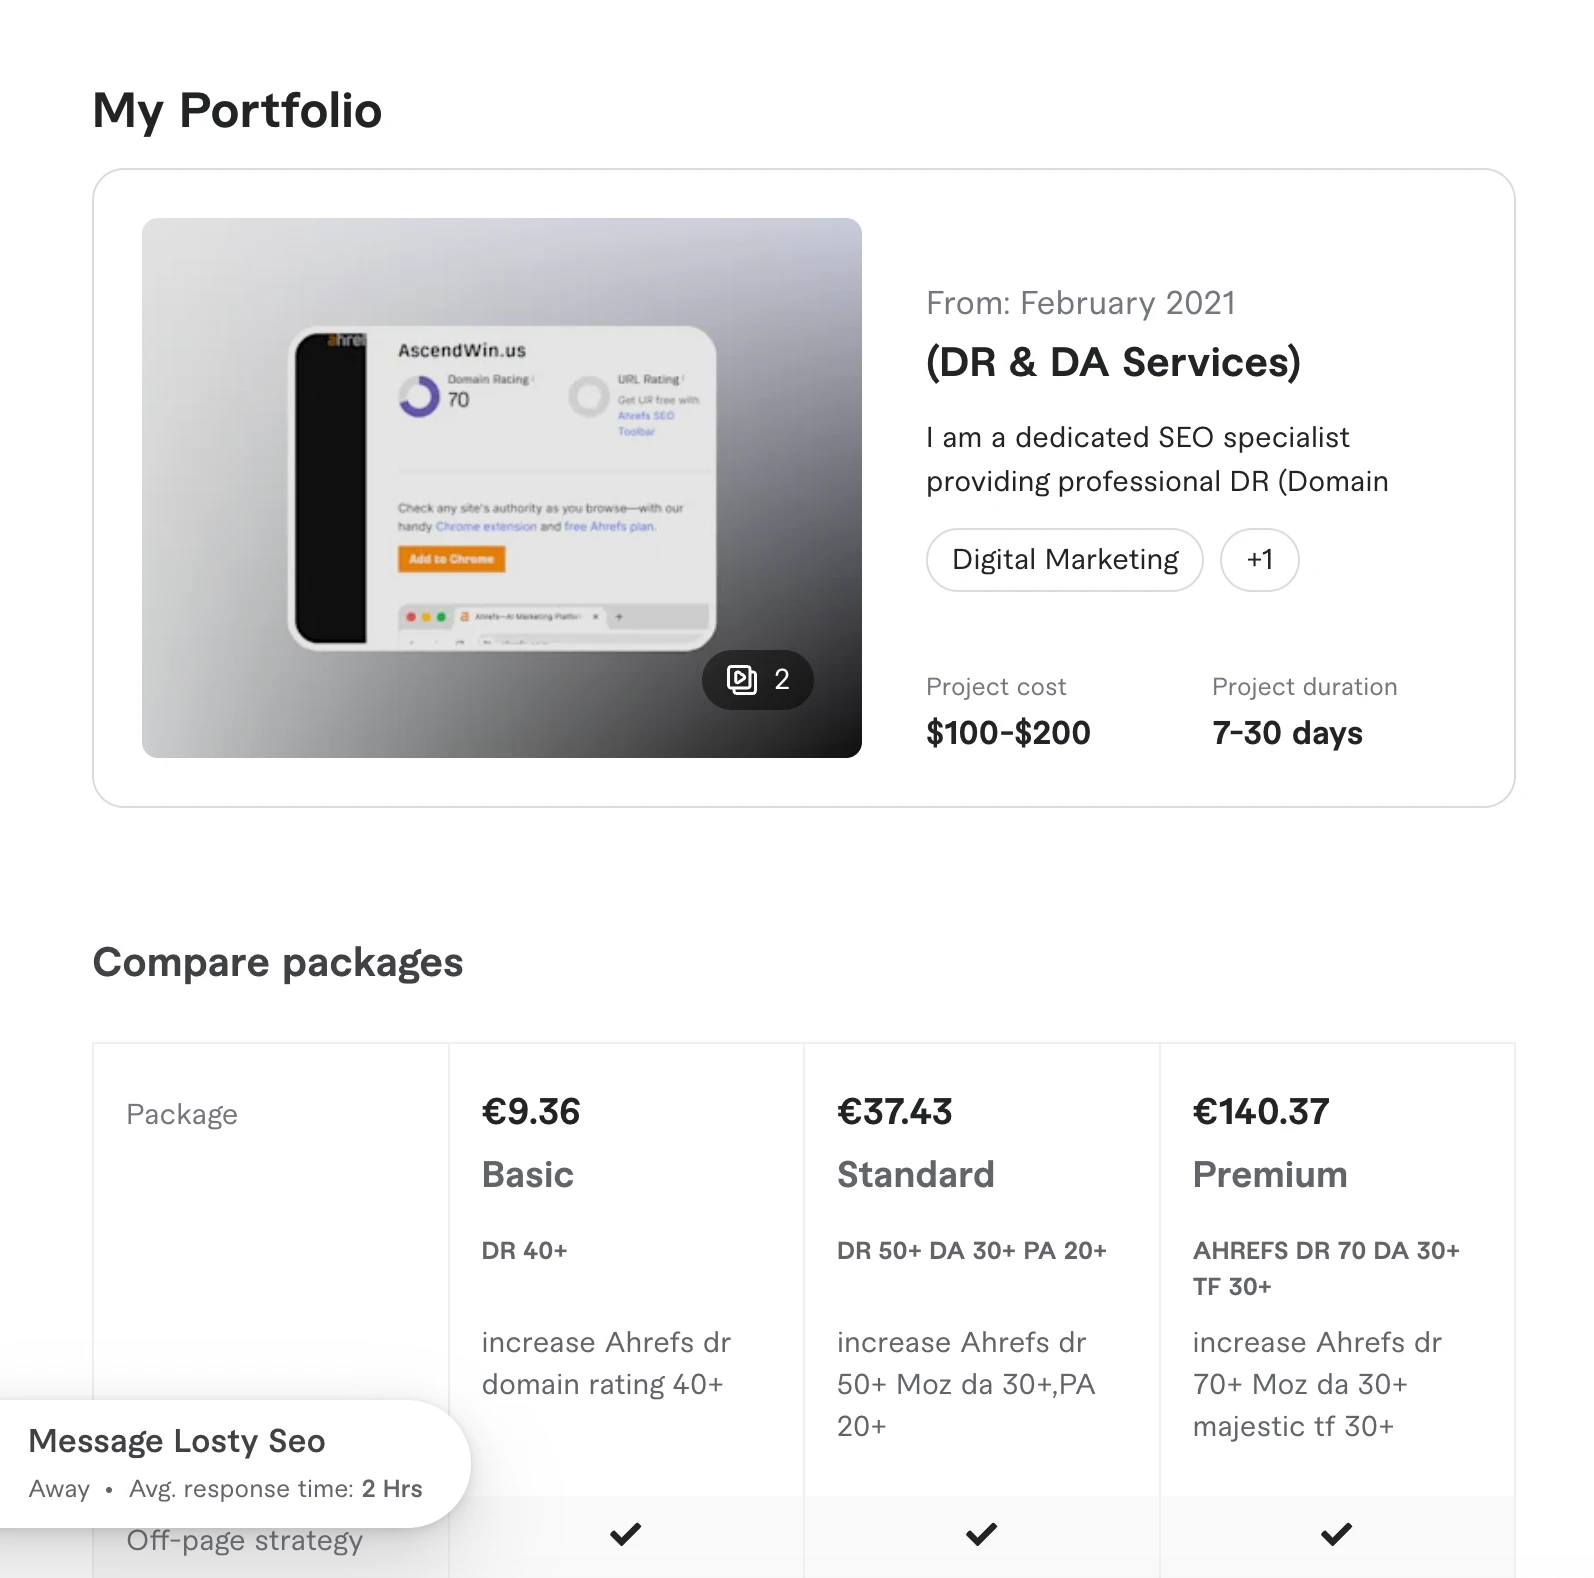
    Fiverr portfolio offering DR and DA boosting services
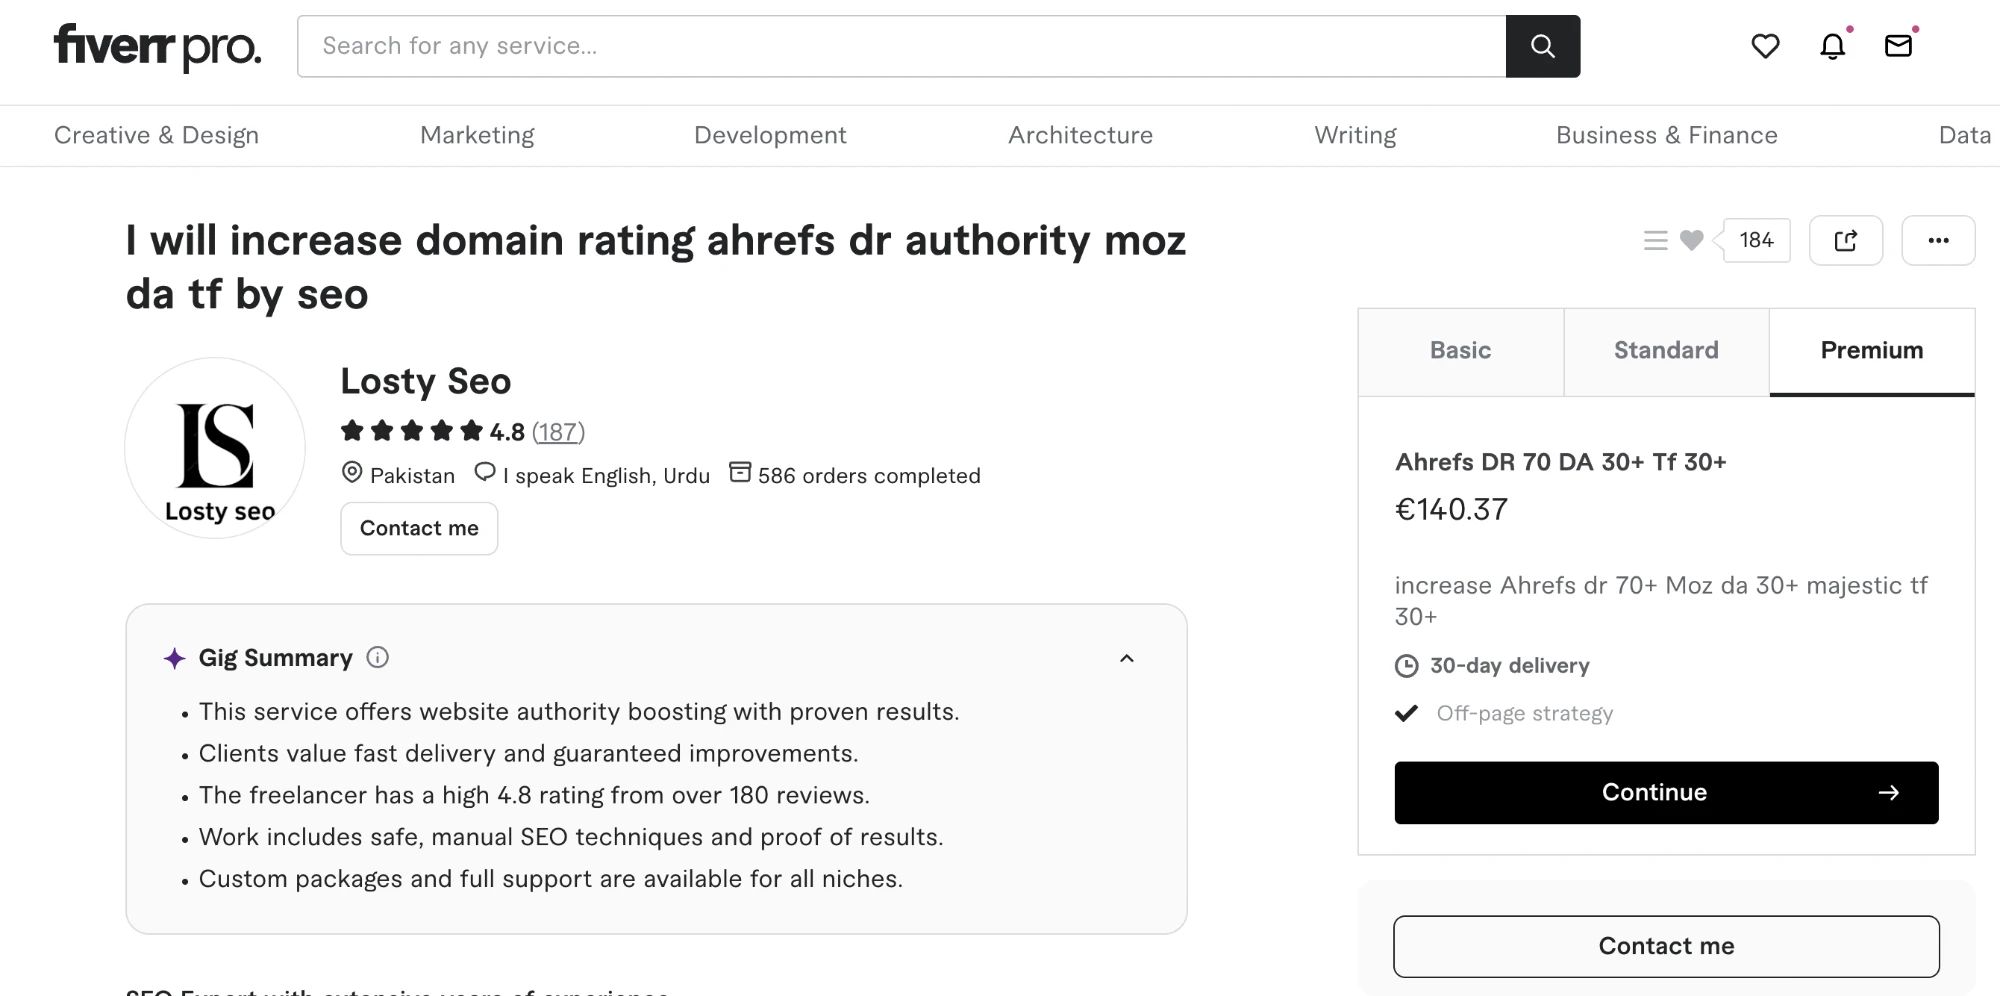
    The offer: “increase DR” packages, up to Ahrefs DR 70 for about €140.
    Fiverr gig: increase domain rating ahrefs dr authority
    A 4.8-star seller, 586 orders completed. Premium tier promises Ahrefs DR 70.

    Then I picked my victim.

    I used the domain admix-70.com, a name I had never registered.

    That’s right. I handed an unregistered domain over to be “boosted.”

    You can check the registration date yourself: 26 September 2026.

    The first backlinks showed up before the domain even existed.

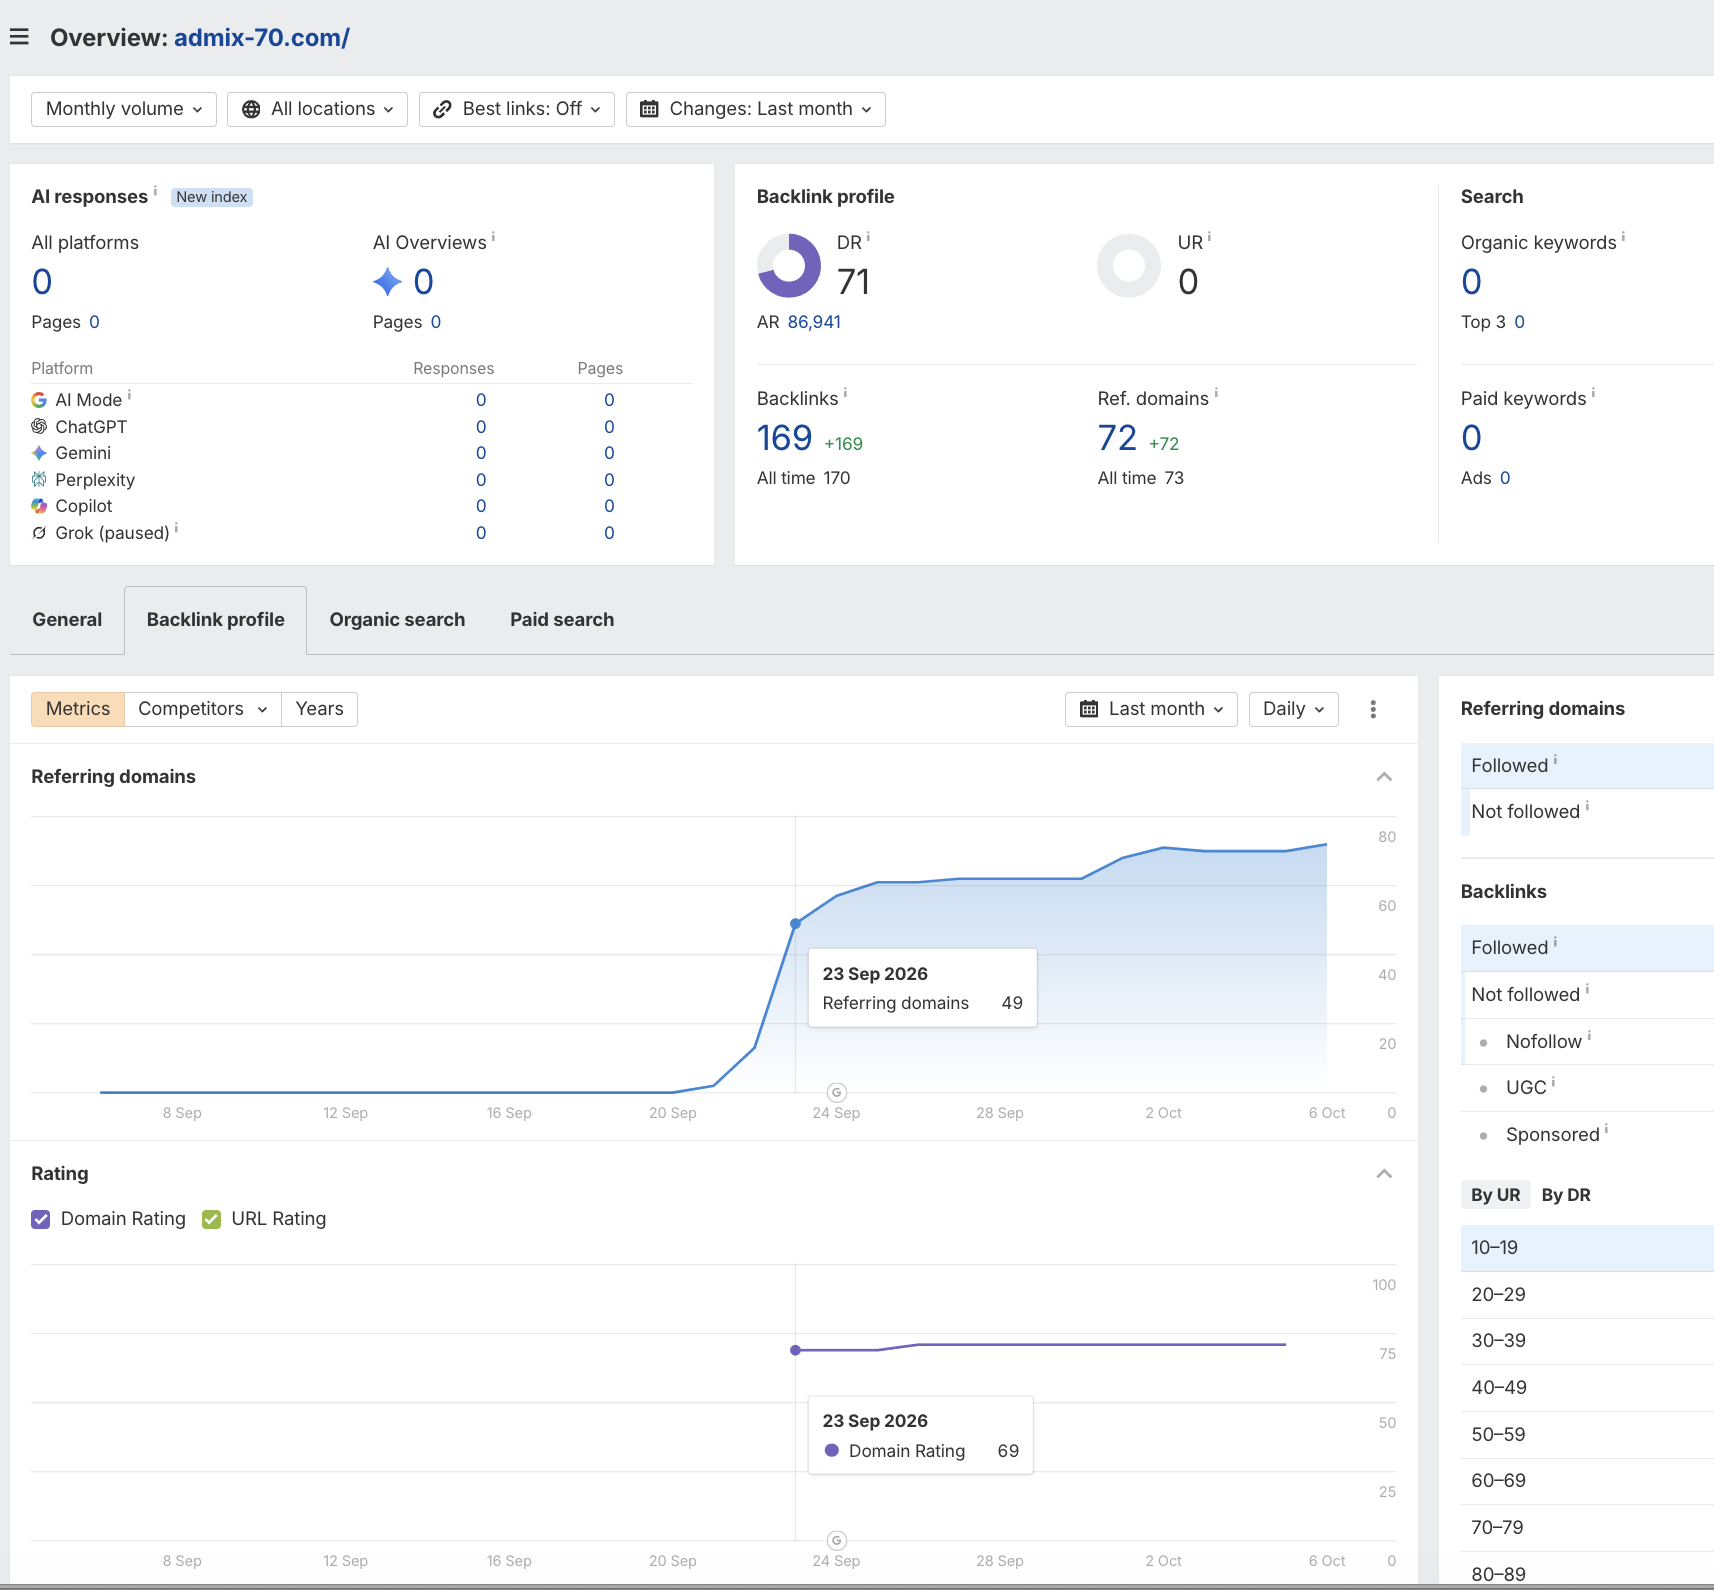
    Ahrefs overview of admix-70.com showing DR 71
    admix-70.com in Ahrefs: DR 71, 72 referring domains, 0 organic traffic, built in a few days.

    And the “backlinks”? Exactly what you’d expect.

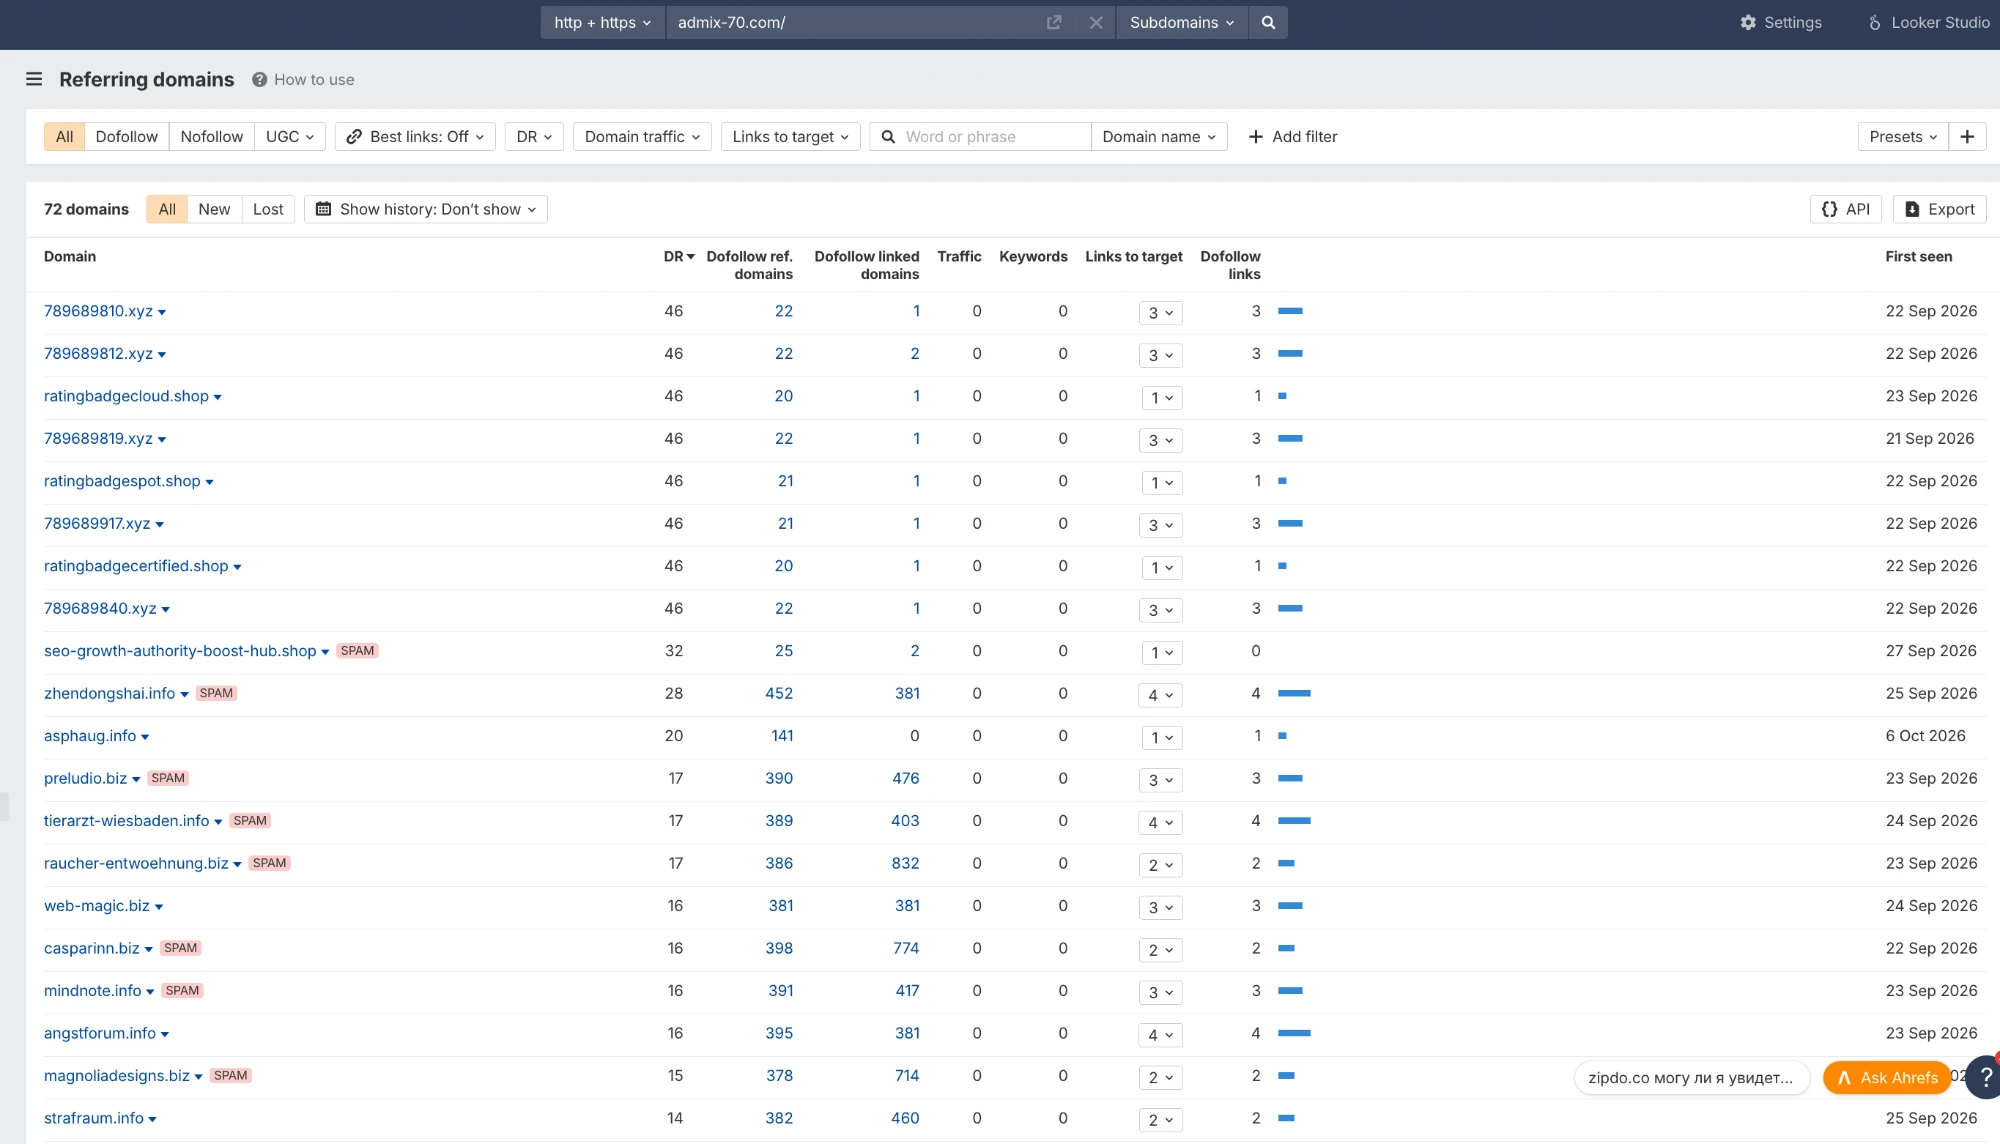
    Ahrefs referring domains list full of spam domains
    The “backlinks”: numbered .xyz domains, ratingbadge*.shop, and a pile of tagged-spam .info and .biz sites.

    That is the whole point.

    You can inflate the DR of a domain that does not exist yet.

    The last time I ran a case like this, I spent a while explaining why a domain I never registered was redirecting somewhere.

    Here’s the twist: once I published the case, someone else went and registered it. Not everyone realized that.

    The result?

    Less than 100 referring domains. Less than a week.

    And the DR was already inflated, all the way to 71.

    That is the experiment.

    Don’t confuse a high metric with a strong website. Always look under the hood.

    Check real traffic, organic keywords, and the actual quality of the referring domains.

    A DR number on its own tells you almost nothing.


    📊 Domain: admix-70.com · registered 26 Sep 2026 · DR 71 from ~72 referring domains, mostly throwaway .xyz / .shop / tagged-spam sites · 0 organic traffic · Ahrefs.

  • How to track your brand in ChatGPT

    How to track your brand in ChatGPT

    Here’s a question most brand trackers get wrong.

    What does your brand’s “rank” in ChatGPT actually mean?

    We decided to find out the hard way.

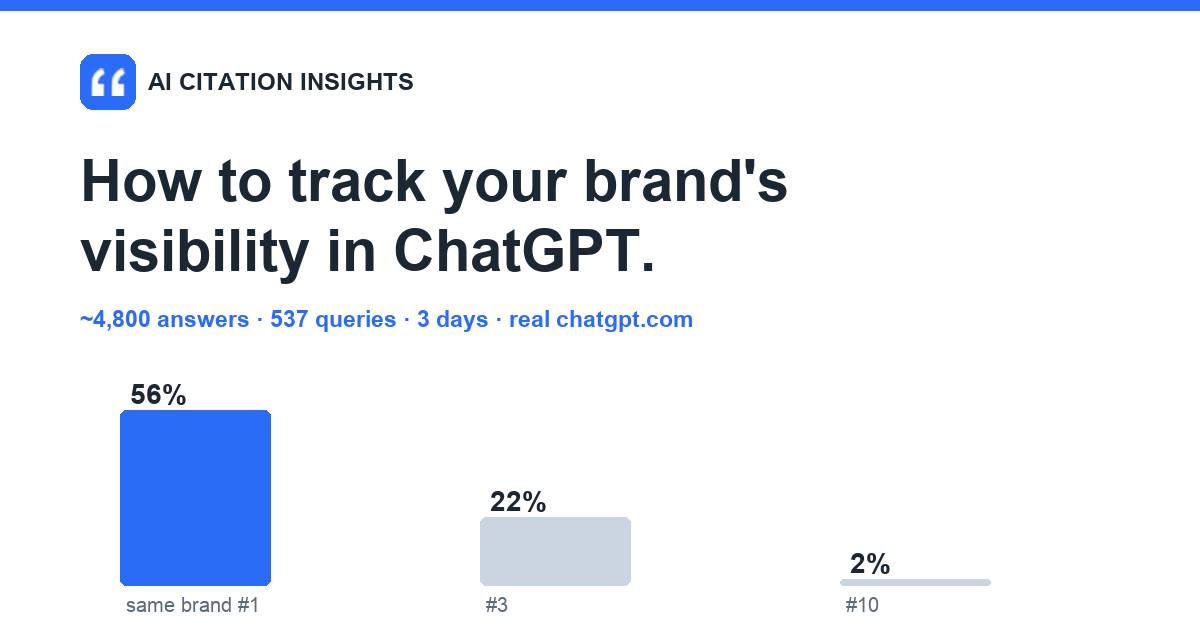
    We took 537 commercial queries (219 SaaS, 158 agencies, 160 consumer) and ran them on three consecutive days. October 4, 5 and 6.

    In the real chatgpt.com, the way a live user sees it: model gpt-5-6, US, English. Not through the API.

    Each query three times a day. Nine runs in total.

    That came to about 4,800 answers.

    A few of the queries we threw at it:

    • “best project management software with time tracking”
    • “affordable google ads agency”
    • “best private student loan rates”
    • …and five hundred more like them.

    Here’s what we learned.

    1. Position only means something for #1

    0%50% 56% 22% 2% same brand at #1at #3at #10
    How often the same brand holds a given rank across all of a day’s runs.

    The same brand holding first place across all of a day’s runs? That happened 56% of the time.

    Drop to third place and it’s already down to 22%.

    At tenth, just 2%.

    So “you’re #4 in ChatGPT” isn’t a metric. You just got lucky that run.

    2. The top 3 is the core; below it is a lottery

    Roughly two brands hold steady in every run.

    The third slot? Pure roulette.

    A fully identical top 3 showed up in only one query out of four.

    3. Measure the cluster, not the query

    Take “best paid search agencies”, three runs in a row:

    • KlientBoost, Disruptive Advertising, HawkSEM
    • KlientBoost, Disruptive Advertising, JumpFly
    • KlientBoost, Disruptive Advertising, WebFX

    Notice the third slot. Different every single time.

    Now zoom out to the whole cluster.

    29 PPC-agency queries. “best ppc agency”, “google ads agency for small business”, “ppc agency for ecommerce”, “ppc agency for lawyers”, “best amazon ppc agency”, and so on.

    Then count the share of queries where each brand lands in the top 3, across the three runs:

    0%50% 69 69 66 52 55 52 24 24 28 KlientBoostDisruptiveWebFX Run 1 Run 2 Run 3
    Share of the 29-query PPC cluster where each brand appears in the top 3, by run.

    From run to run, almost nothing changes.

    The randomness of individual answers cancels itself out. The average difference is about 5 percentage points.

    So use a cluster of 20–30 queries. At 10 queries the share swings ±15–30 pp and tells you little.

    And in the report, don’t write “brand #3 for this query.” Write “the brand is in the top 3 in 24% of the cluster’s queries, and at #1 in 8%.”

    Clusters give you signal. Single queries give you noise.

    4. The API is not what your client sees

    API ↔ real chatgpt.com, same queries: top 3 agrees only 31–51% of the time.

    Real chatgpt.com ↔ itself a day later: agrees 51–78% of the time.

    We ran the same queries through the API too.

    The API is simply a different picture.

    So if your tracker pulls from the API, it is not measuring what your customer actually sees.

    5. Visibility swings because of query fan-out

    Before answering, ChatGPT breaks your query into several of its own search queries. That’s query fan-out.

    You don’t see it in the web interface. But a scraper does: on average about two searches per answer.

    Within a single day those searches mostly repeat (75–83%). Across different days they overlap only 53–62%.

    Change the fan-out, change the pages found, change the top 3.

    The takeaway? The more pages that mention your brand, the more consistently ChatGPT names you.

    Takeaways

    • Track the real chatgpt.com, not the API. Check how your tracker collects data, because the API’s top 3 matches real ChatGPT only 31–51% of the time.
    • Use 20–30 queries per cluster.
    • Report the share in the top-3 core and the share of runs at #1, not raw position.
    • Collect the pages through which your brand enters the answer. That’s where your action plan already is.

    📊 537 commercial queries (219 SaaS · 158 agencies · 160 consumer) · gpt-5-6 · US · English · 3 runs/day × 3 days ≈ 4,800 answers · real chatgpt.com with an API cross-check.

  • Your listicle slot decides AI mentions

    Your listicle slot decides AI mentions

    Getting into a “best [X]” listicle is now table stakes for AI search.

    But inclusion alone doesn’t decide anything. It won’t make ChatGPT or Google’s AI Overview actually name you.

    So we wanted to measure what does: your position in the listicle.

    We analyzed 12,564 listicles cited by AI. Then we measured how often a listed brand got named, based on its slot in the article, across ChatGPT and Google AI Overview.

    Here’s what we found.

    The drop-off by position is steep

    0%50% 86 77 72 64 61 53 44 37 22 21 10 12 #12–3#4 5–910–1415+ ChatGPT Google AI Overview
    % of times a listed brand is named, by its slot in the cited listicle.

    A brand at #1 gets named 86% of the time in ChatGPT. And 77% in Google AI Overview.

    By #4, that drops to 61% and 53%.

    In the 10–14 range, it falls to about 22% and 21%. Past #15, roughly 10–12%.

    The takeaway?

    Being #2 in a listicle and being #8 in the same listicle are completely different outcomes.

    Is it just that stronger brands rank higher?

    Fair objection.

    Maybe bigger brands simply land in higher slots, and position is incidental.

    So we tested it. We held the brand constant and compared the same brand across different listicles. Each slot got scored against that brand’s own average mention rate.

    0 +17.4 +6.4 +1.2 −5.9 −15.2 −20.1 #12–3#4 5–910–1415+
    Percentage points above or below the same brand’s own average, by slot.

    Same brand. Different slots. The pattern held.

    The top slot ran about +17 points above its own baseline. The #15+ range sat about −20 points below it.

    Position moved the outcome even with the brand held constant.

    One more check. The effect held after we removed self-published listicles. And it showed up across roughly 75% of brands in the dataset, not just a handful of outliers.

    Both position and brand strength matter

    The brands named most often share two traits. A strong slot. And existing brand authority.

    Position is a real, measurable factor. And it’s distinct from brand authority.

    Both move how often AI names you. So fight for the higher slot, and keep building the brand behind it.


    📊 12,564 AI-cited listicles · ChatGPT + Google AI Overview · named-rate by position · within-brand comparison against each brand’s own average · self-published lists excluded · effect present across ~75% of brands.